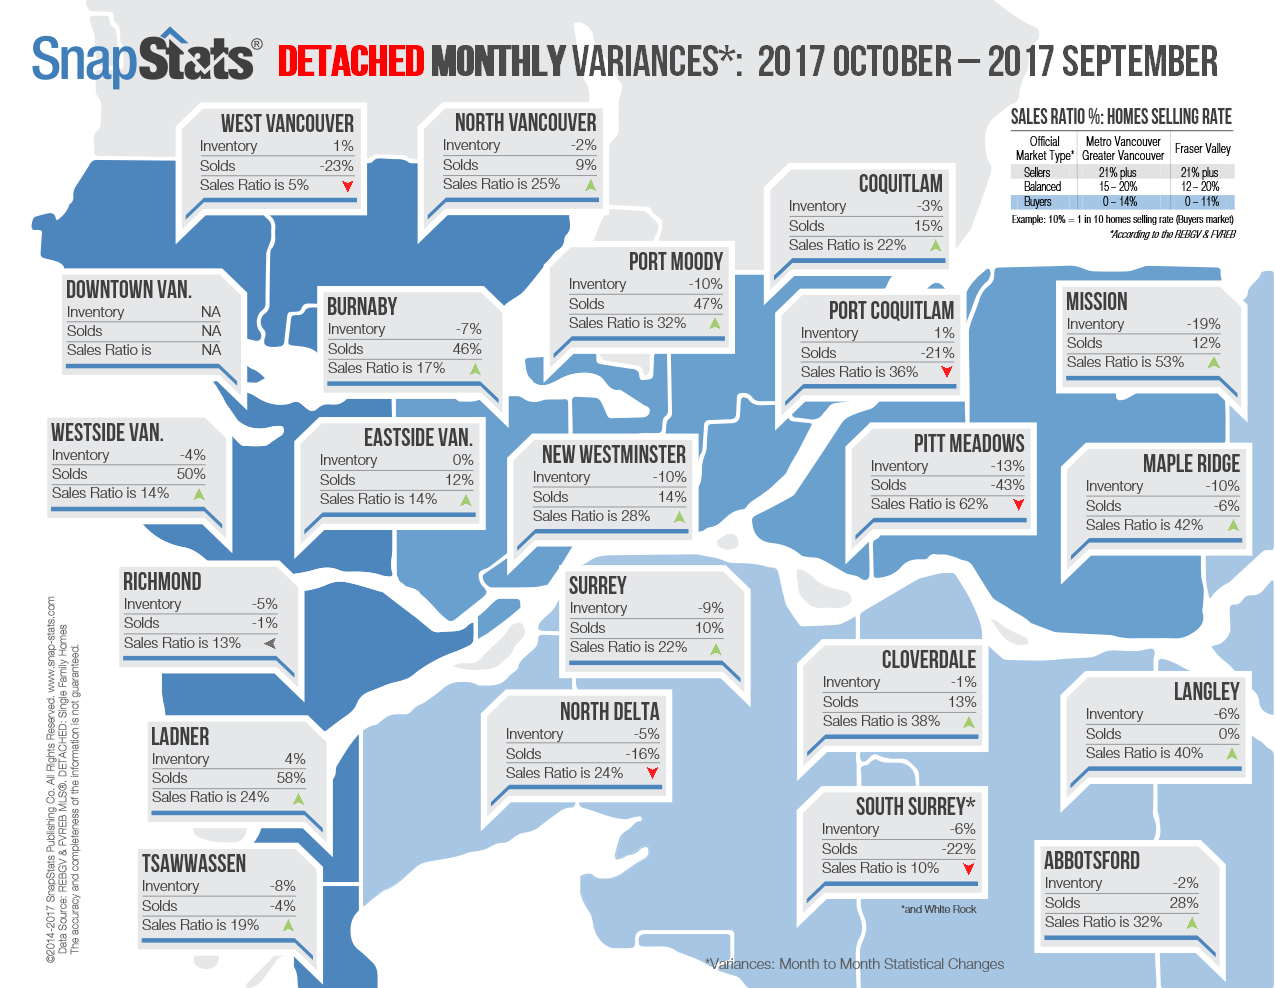
Curious about real estate market statistics for more than just the Fraser Valley? Here are two maps with brief snapshots of the activity from the west side of Vancouver through to Abbotsford/Mission. The first map is for attached properties (condos and townhomes) and the second map is for detached properties (single family homes, acreages, etc). These maps show the change between September 2017 and October 2017. These numbers confirm the trend of incredible activity in condos! With the exception of West Vancouver, it has been a seller's market for attached homes throughout the Lower Mainland. There is greater variation in the detached home market; although it is still a seller's market in most areas. Of course, these are only overview numbers - for an accurate analysis of the market in your neighbourhood, please do not hesitate to contact me!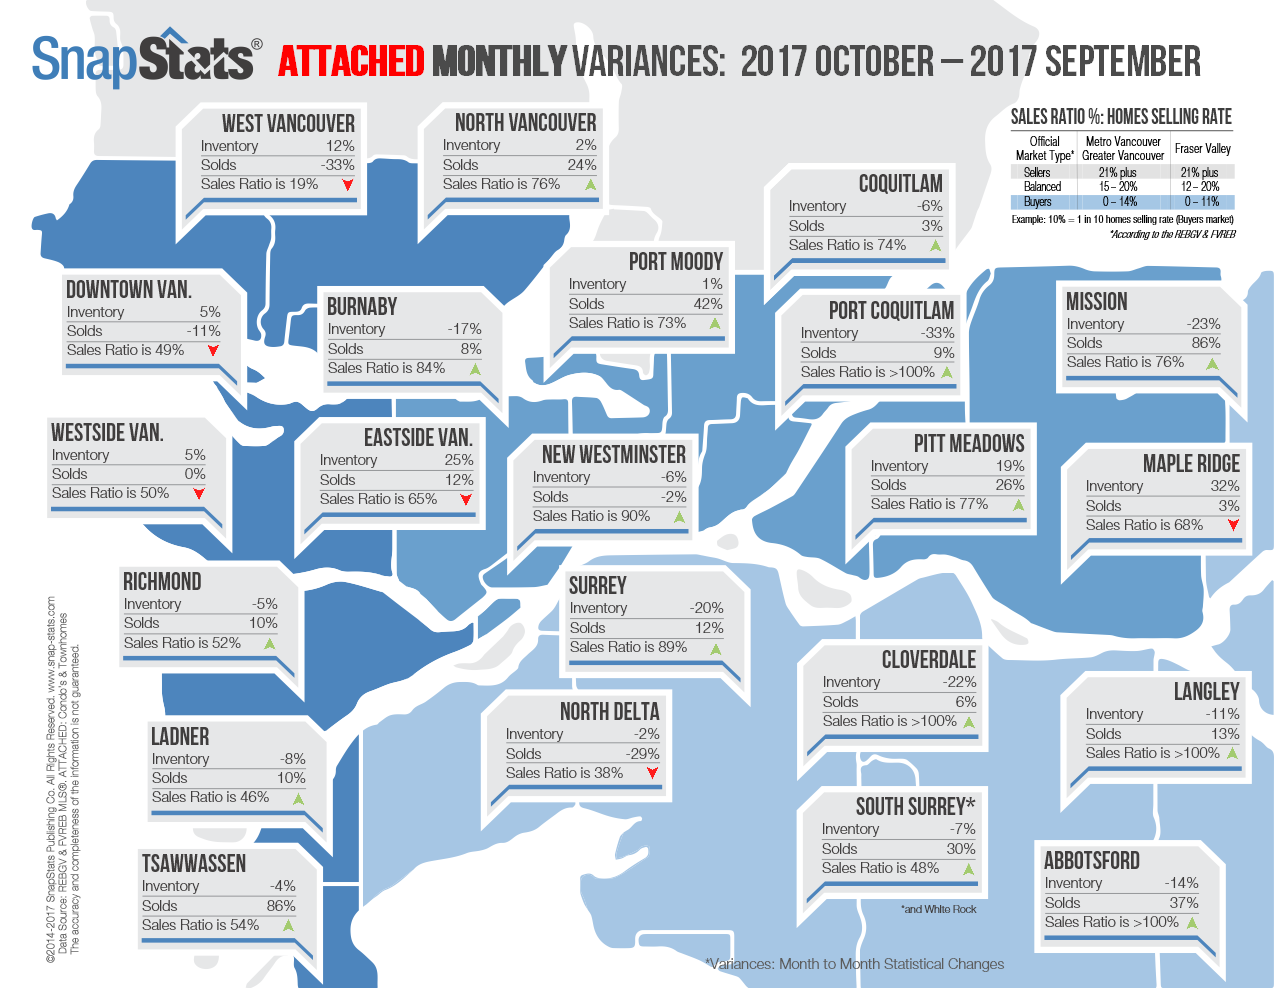
e
e